
For this tutorial in video form, click here
In this article, we’ll go through some debugging tips when writing custom functions. Oftentimes, you’ll get mysterious errors that will be difficult to understand.
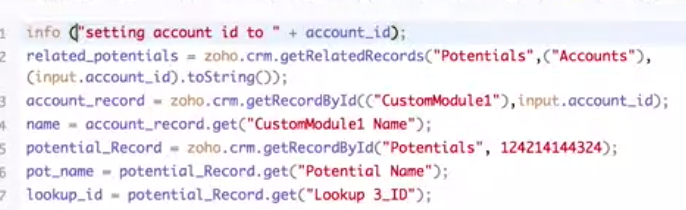
Consider this example:
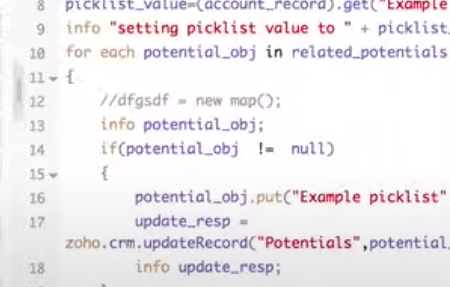
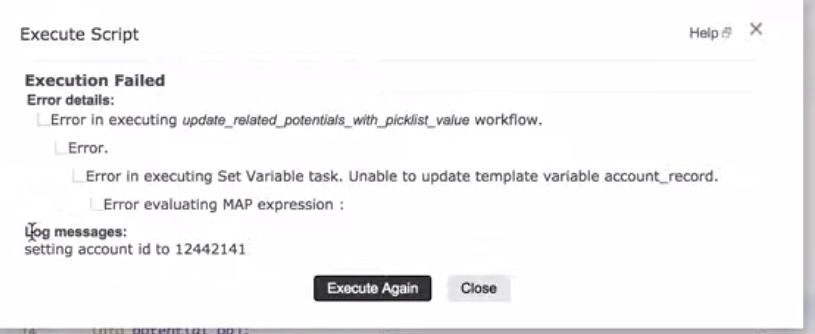
When we save & execute, we get this weird error:
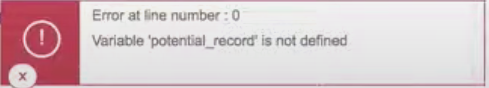
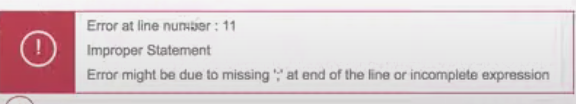
It’s strange because there’s nothing at line 0. Quite often the line numbers in errors are way off which makes it hard to figure out what part of the code is causing the problem. I find this is particularly problematic when you have a syntax error inside a for loop. The line numbers are always wrong then.
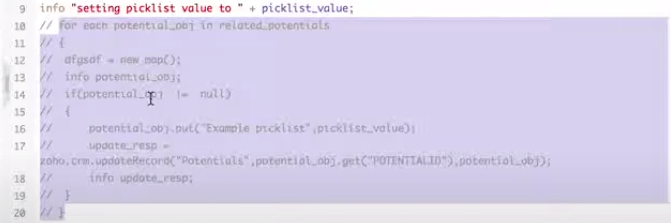
The best way I’ve found to identify the cause of the errors is to comment out code, singling out where the bug is. When you comment out a line and it suddenly saves without problems, you know the error is there.
Info Statements
Once you get the code running, it might not actually do what you want it to. In that situation, we’ve found info statements very valuable. Info statements allow you to get a debug message. As an example, let’s put one at the top of this code:
If we save and execute this, we’ll get the log message which can be very helpful for debugging when you’re doing save and execute.
Send Mail Tasks
When you move onto custom function execution via a workflow, you won’t get access to those info statements. There’s no way to view historical logs from past function executions. The only way we’ve found to debug in that case is to use a send mail task. Essentially, you’re sending a message to yourself via the code:
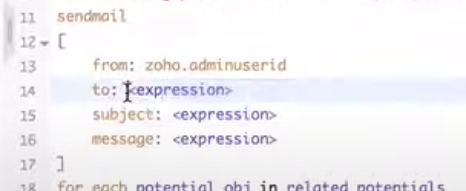
From there, you can put data in the message to help you figure out what’s going on.
Conclusion
We find those three techniques useful:
- Commenting out code to single out the bugged part.
- Adding in info statements.
- Using send mail tasks.
Hopefully one of these works for you. Good luck!